You are here: Nature Science Photography – Contrast – Contrast perception
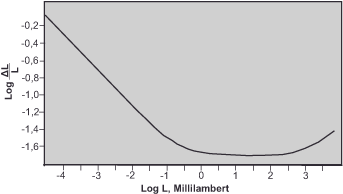
Even though we now know which brightness differences the visual system can process, we still lack the measure of the necessary difference to even speak of contrast. This has been determined experimentally. The subjects were shown an environmental field of brightness LU that filled most of their visual field in order to fixate their adaptation state. In the center of this were two contiguous areas whose brightnesses differed slightly (L and L+∆L). A variety of combinations between LU, L, and ∆L were then presented, and subjects had to indicate whether they could distinguish ∆L from L. Plotted in a coordinate system, this resulted in the curve in figure 18. On the Y-axis we see the logarithm of the ratio of ∆L to L, on the X-axis the logarithm of the ambient brightness LU.

We can see from it that the contrast discrimination ability in the range between 0 and +2.5 log Millilambert (the unit Lambert – la – is a measure for the luminance and 1 la corresponds approximately to the brightness of an average gray tone on a sunny, slightly overcast day) is almost constantly 1 %. So, in this 2.5 decade range, ∆L must be 1% greater than L and this means that our discrimination ability is nearly logarithmic for two approximately equal brightness ranges. The 1% value applies to ideal illumination and viewing conditions, such as those found at best in the laboratory. Under practical average conditions, we may assume a difference threshold of about 2 %. At intensities below this average range, our discriminating ability decreases continuously and is lower than the peak value by a factor of 8 at -4 log millilambert. Larger intensities also record a drop, but only a slight one.
Our discrimination ability is low at low brightness, high at medium brightness, and again somewhat lower at high brightness. From here, we can draw the following conclusions: First: In dark areas, we can perceive smaller absolute differences in brightness than in bright areas. We can probably perceive the difference between 10 and 11 cd/m2, but not that between 400 and 401 cd/m2. Second: Since the perceived brightness roughly corresponds to the logarithm of the intensity, the tonal values of a scale must differ by a constant factor so that they appear uniform, e.g., 50, 100, 200, 400 cd/m2 or as in scale B in figure 19. A scale whose tonal values are separated by the same distance, e.g. 50, 100, 150, 200, 250 cd/m2, does not appear uniform to the human eye, because the differences in brightness become smaller and smaller. This represents scale A in figure 19.
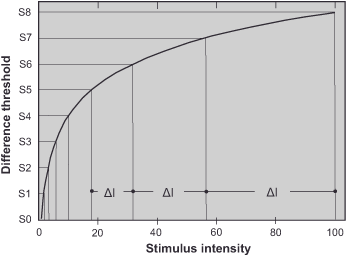
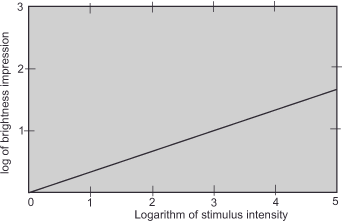
On the suprathreshold stimulus side, this results in the realization that we have to increase intensity nearly ninefold to achieve a doubling of perceived brightness, and that brightness as a sensation quantity roughly corresponds to the cube root of light intensity. In a coordinate system with linear scale division, we get the curve in figure 20 as a result. In one with logarithmic scales, we plot the one in figure 21. Both curves will be of interest for the gamma correction later.


The first person to establish that all our sensory perceptions are based on such a logarithmic stimulus conversion was Ernst Heinrich Weber. As early as in the 1840s, he noticed that his test subjects only perceived a difference when comparing weights if the comparison weight was in a certain ratio to the standard weight. For example, they could detect differences between 100g and 105g or 200g and 210g, but not smaller differences. In 1860, Gustav Theodor Fechner formulated Weber’s law based on this.
Formula 9

K = Webers ratio
ΔS = deviation of the standard stimulus
S = Standard stimulus
Generally, our perception only registers a noticeably stronger sensation when the increase is in a constant ratio to the preceding stimulus. The greater the original stimulus, the greater the magnitude of the physical change must be to produce a just perceptible difference. If we apply the equation to the weight comparison, we find that for the standard of 100 g K = 5/100 = 0.05 and for the standard of 200 g K = 10/200 = 0.05. Thus, Werber’s quotient is constant at 0.05 and 5% of the standard weight, respectively. For the sense of touch, the minimum increase required is about 3% of the skin pressure, and for the sense of taste, the concentration must increase by 10-20 %. For brightness perception, the result was the value of 2 %, which was good for the time.
Next The number of tone values in a print
Main Contrast
Previous Pupil size
If you found this post useful and want to support the continuation of my writing without intrusive advertising, please consider supporting. Your assistance goes towards helping make the content on this website even better. If you’d like to make a one-time ‘tip’ and buy me a coffee, I have a Ko-Fi page. Your support means a lot. Thank you!


 Since I started my first website in the year 2000, I’ve written and published ten books in the German language about photographing the amazing natural wonders of the American West, the details of our visual perception and its photography-related counterparts, and tried to shed some light on the immaterial concepts of quantum and chaos. Now all this material becomes freely accessible on this dedicated English website. I hope many of you find answers and inspiration there. My books are on