

You are here: Nature Science Photography – Visual acuity – Image sharpness II
Now we have an idea of what our visual system and imaging components are capable of in terms of resolving fine details. We need to determine the amount of detail we should incorporate into the final image to achieve the desired „sharp“ impression. To answer it, we first relate the total resolving power of the visual system to a tangible scale in two steps. This refers to the number of black and white line pairs per unit length (e.g., per mm) that the human eye can resolve. We already know it from the bar test discussed at the beginning and from the modulation transfer function. With this measure, we can calculate the maximum resolution required for a given image format or viewing distance. Using the average resolving power of 1 arcminute as a base, we can calculate the value as follows:
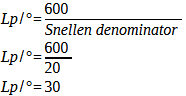
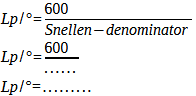
Calculation of the number of line pairs per 1° (Snellen denominator = 2nd number of the Snellen value). This example illustrates a Snellen visual acuity of 20/20. If your eye test results indicate a Snellen value other than 20/20, substitute this number for 20 under the fraction bar.
Calculation 37a – Default value
Calculation 37b – Your personal value
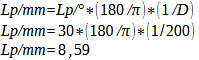
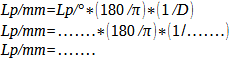
Calculation of the number of line pairs per millimeter dependent on the viewing distance (D = viewing distance in mm). For the minimum viewing distance of 200 mm to be assumed for an adult this results in:
Calculation 38a – Default value
Calculation 38b – Your personal value
This gives you all the options at hand to calculate the resolution for any visual acuity and viewing distance. For the average resolving power (20/20), I already take this work off your hands with the following table (calculation of pixels per inch [ppi]: Lp/mm*2 [because it takes 2 pixels to represent a pair of lines]*25.4 mm [1 inch=25.4 mm]). It assumes that the viewing distance increases with image size. Usually this is the case, so that one can grasp the represented motive at a glance. Utilizing the diagonal format for the viewing distance ensures this. If, on the other hand, you want your poster to make a sharp impression even when inspected up close, you have to calculate with the resolution value for the average closest focusing distance.
| Image format | Viewing distance = format diagonal | Maximum resolution lp/mm | Maximum resolution ppi | Minimum resolution lp/mm | Minimum resolution ppi |
| 9×13 cm | 16 cm | 10,75 | 546 | 6,25 | 317 |
| 10×15 cm | 18 cm | 9,55 | 485 | 5,55 | 282 |
| 11×17 cm | 20 cm | 8,59 | 436 | 5,00 | 254 |
| 13×18 cm | 22 cm | 7,81 | 400 | 4,45 | 226 |
| 25 cm | 6,88 | 350 | 4,0 | 203 | |
| 20×30 cm | 36 cm | 4,77 | 242 | 2,77 | 141 |
| 30×45 cm | 54 cm | 3,18 | 161 | 1,85 | 94 |
| 40×60 cm | 72 cm | 2,39 | 121 | 1,38 | 70 |
| 50×75 cm | 90 cm | 1,91 | 97 | 1,11 | 56 |
Your sharp eye will not have failed to notice that the table also indicates a minimum resolution in addition to the maximum resolution. This distinction is necessary because the calculated 8.59 lp/mm is only the limit above which someone with average vision (20/20) can no longer perceive additional resolution. It says nothing about how much resolution is necessary at the lower limit to perceive a sharp impression. This lower limit cannot be clearly defined because it depends on the subject itself. If the subject contains a lot of details, as is often the case with nature and landscape photographs, the resolution should be slightly higher than if the image is determined by the few clear lines of an architectural or factual photograph. For the first case, practice gives a value between 4 and 5 Lp/mm; for the second one, between 3 and 4 lp/mm. For the calculation of the table, I used a practical circle of confusion with a diameter of 0.2 mm. This value is between our maximum resolving power and the value of 0.32 mm used by the industry. This corresponds to 1/0.2mm = 5 lp/mm, where the resolution in lp/mm and the point spread function are converted into each other via the reciprocal. Therefore, a resolution window of practically usable values exists between 5 and 8.6 lp/mm, which, with average eyesight and without direct comparison with a higher-resolution image, guarantees a visually sharp impression. However, a higher resolution consistently yields a sharper impression within this range! We have already found something very similar in the case of the circle of confusion diameter (see
„Circle of confusion and depth of field – Perceived sharpness extends over more than one plane„).
Now, let’s delve into the details and determine the maximum size at which we can print the various image formats, starting from our maximum values. I’m assuming a viewing distance that corresponds to an average adult’s closest focus, 20 cm, to ensure that the image will appear sharp even when inspected up close. The film I use is the Fuji Velvia 100F Professional, which achieves 80 lp/mm with a practical object contrast of 1.6:1.
35 mm
Lens 120 Lp/mm, Film 80 Lp/mm
= 1/120 + 1/80 = 1/0,021 = 48 Lp/mm
= 48 Lp/mm /5 Lp/mm = Maximum magnification of 9.6x
= 3,6 cm * 9,6 = 34,6 cm image width

Medium format 6 x 7 cm
Lens 90 Lp/mm, Film 80 Lp/mm
= 1/100 + 1/80 =1/0,0225 = 44,4  Lp/mm
= 44,4 Lp/mm/5 Lp/mm = Maximum magnification of 8.9x
= 7 cm *8,9 = 62,3 cm image width

Large format 4x5“ (10,1 x 12,7 cm)
Lens 70 Lp/mm, Film 80 Lp/mm
= 1/70 + 1/80 = 1/0,027 = 37,3 Lp/mm
= 37,3 Lp/mm/5 Lp/mm = Maximum magnification of 7.4x
= 12,7 cm*7,4 = 94 cm Bildbreite

Large format 8x10“ (20,3 x 25,4 cm)
Lens 70 Lp/mm, Film 80 Lp/mm
= 1/70 + 1/80 = 1/0,027 = 37,3 Lp/mm
= 37,3 Lp/mm/5 Lp/mm = Maximum magnification of 7.4x
= 25,4 cm*7,4 = 188 cm image width
The maximum print size thus increases from a good 35 cm wide in 35 mm format to a remarkable 1.88 m in large format. The larger negative format proves advantageous as it requires less enlargement. In addition, the figures indicate that the limiting factor shifts from the film to the lens as the format size increases.
In 35 mm format, the combination of a good lens (120 Lp/mm) with an average film (50 Lp/mm) results in a system resolution of 35.3 Lp/mm. If we combine the same average film (50 Lp/mm) with a first-class lens (150 Lp/mm), the system resolution increases only by a meager 6% to 37.5 Lp/mm, despite the considerable investment. But if we combine the good lens (120 Lp/mm) with the first-class Velvia (80 Lp/mm), the total resolution increases by a smooth 26.5% to 48 Lp/mm. Here, the film is clearly the resolution-limiting element.
In large format, the situation can be described as follows: Average lens (50 Lp/mm) and average film (50 Lp/mm) = 25 Lp/mm. First-class lens (90 Lp/mm) and average film (50 Lp/mm) = 32 Lp/mm. Average lens (50 Lp/mm) and first-class film (80 Lp/mm) = 31 Lp/mm. Only the combination of a first-class lens (90 Lp/mm) and first-class film (80 Lp/mm) moves the system resolution forward a sustained step at 42 Lp/mm and shows that film is far less limiting at this format size.
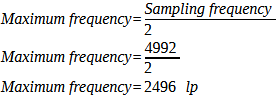
In the digital realm, we calculate the resolution value at the Nyquist frequency. So in the case of a Canon EOS-1Ds Mark II, which resolves 4992 pixels horizontally, the result is as derived in the section „The resolving power of digital image carriers„:
Formula 31
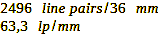
If we divide the 2496 line pairs by the width of the sensor (36 mm), we get the number of line pairs per millimeter:
Calculation 39
35 mm digital
Lens 120 Lp/mm, Sensor 69 Lp/mm
= 1/120 + 1/69 = 1/0,023 = 44 Lp/mm
= 44 Lp/mm /5 Lp/mm = Maximum magnification of 8.8x
= 3,6 cm * 8,8 = 33 cm image width
The figures show the digital system is comparable to the analog one. But more is possible. Many practitioners report on the web that they output images taken with such or similar cameras magnified up to 18x in good quality. This is quite surprising, given that the sensors only measure 35 mm in size. With film, this is unthinkable in this format because the clearly visible grain would completely destroy the impression of sharpness. On the other hand, high-quality digital sensors boast a very low noise level, which serves as the digital equivalent of analog grain, enabling them to enlarge their images significantly. However, the low noise level is not the only factor contributing to this remarkable digital feature, which challenges the analog medium format. Let’s recall the contrast sensitivity feature. Our visual system is particularly sensitive to spatial frequencies between 4 and 8 cycles per degree, and it is in this range that the MTF of high-quality digital systems is higher than that of the best silver films. (Note that I wrote this several years ago and that technology has developed enormously in the meantime.)
Next The mathematical short path to a sharp image
Main Visual acuity
Previous The overall resolution of an imaging system
If you found this post useful and want to support the continuation of my writing without intrusive advertising, please consider supporting. Your assistance goes towards helping make the content on this website even better. If you’d like to make a one-time ‘tip’ and buy me a coffee, I have a Ko-Fi page. Your support means a lot. Thank you!
 Since I started my first website in the year 2000, I’ve written and published ten books in the German language about photographing the amazing natural wonders of the American West, the details of our visual perception and its photography-related counterparts, and tried to shed some light on the immaterial concepts of quantum and chaos. Now all this material becomes freely accessible on this dedicated English website. I hope many of you find answers and inspiration there. My books are on