You are here: Nature Science Photography – Contrast – Contrast perception – The dynamic range of the visual system
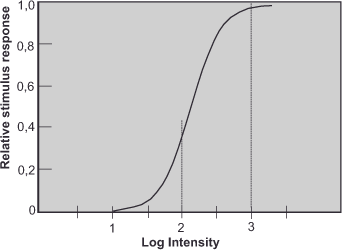
At the lowest level, the photoreceptors are responsible for the perception of brightness and differences in brightness. To represent their response to a brightness stimulus, we use the characteristic curve. The characteristic curve plots the stimulus brightness in log10 units on the x-axis and compares it with the linear receptor responses on the y-axis. The latter indicates the proportion between minimum and maximum response values. To establish a characteristic curve for the photoreceptors, science made use of animal experiments. Determined in vivo, i.e., on an intact retina, a curve results as shown in figure 11.

The first thing you notice about it is the S-shape, which is mathematically identified as a sigmoid function and is a familiar shape to us photographers from the tone value curves of our image carriers. Here, it brings us back to the nonlinear synaptic transmission: The release of the transmitter at the synapse (the contact points between the nerve cells and other cells) follows the depolarization of the receptor (quasi the presynaptic potential) in an exponential way. For example, a depolarization value of 1.50 mV produces a conductance on the other side of the synapse that is higher by the exponent e (1.50e). This type of processing minimizes the noise level and has the pleasant side effect of introducing a smooth, barely noticeable transition to either end of the dynamic range. Both the soft transition to prevent tonal value breaks and the noise reduction will be encountered again in both analog and digital contrast behaviors. Further, it can be seen from the curve that the receptors process brightnesses in the range of 3 log10 units of retinal illuminance (the unit is called Troland), which corresponds to a contrast ratio of 1000:1 (= 8.5 exposure stops) and that the brightness differences in a range of 1 log10 unit (corresponding to a contrast ratio of 10:1 or 3.3 exposure levels [Log2 = 0.3, 10/0.3 = 3.3]) are linearly converted and compressed above or below this range. It is in this linear range that the discriminative ability is most pronounced. The high slope of the curve (its gamma value) in this linear range says that contrast is increased. Thus, the perceived differences in brightness are greater than the actual differences in intensity.
These numbers reflect the perfect adaptation of the visual system to our living environment, because most fully illuminated object surfaces (with the exception of highlights, reflections, or the light sources themselves) have contrast ratios of only 20:1 to 80:1. Shaded areas can reduce surface brightnesses by about 1 log10 unit, setting the requirement as high as 200:1.
Next The light/dark adaptation
Main Contrast
Previous The dynamic range of the visual system
If you found this post useful and want to support the continuation of my writing without intrusive advertising, please consider supporting. Your assistance goes towards helping make the content on this website even better. If you’d like to make a one-time ‘tip’ and buy me a coffee, I have a Ko-Fi page. Your support means a lot. Thank you!


 Since I started my first website in the year 2000, I’ve written and published ten books in the German language about photographing the amazing natural wonders of the American West, the details of our visual perception and its photography-related counterparts, and tried to shed some light on the immaterial concepts of quantum and chaos. Now all this material becomes freely accessible on this dedicated English website. I hope many of you find answers and inspiration there. My books are on