You are in „Things and Concepts“
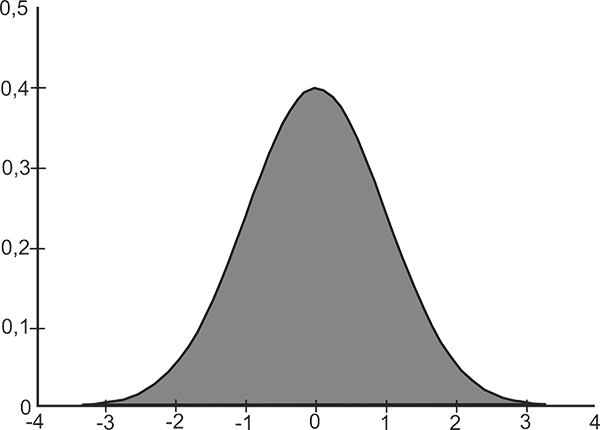
In the 1960s, French mathematician Benoit Mandelbrot began to recognize concepts such as order in apparent chaos and self-similarity as ghostly schemes in many systems. One area of many he tackled during his time in IBM’s basic research was fluctuations in the price of cotton. The standard tool for plotting such variations was and is the normal distribution curve, or Bell Curve (see figure), after the mathematician Johann Carl Friedrich Gauss (1777 to 1855). It shows the statistical distribution of data values in the form of a finely graduated bar chart. The horizontal axis plots the data values, with the height of each bar indicating the frequency of each value in the analyzed system. Typically, the distribution of most values revolves around the average, which accounts for the prominent hill in the middle of the curve. Mandelbrot’s problem was this: No matter how he analyzed cotton prices, the results never fit the normal distribution. In the end, he managed to gather all the cotton price quotes dating back to 1900, and during his analysis of this vast database on the IBM mainframes, he discovered something remarkable:
„The data values that produced variances from the point of view of normal distribution produced symmetry when viewed from the point of view of scale. Each individual price change was random and unpredictable. But the sequence of changes was independent of scale: the curves for daily and monthly price changes matched each other perfectly, were congruent. Even more incredible, analyzed in Mandelbrot’s way, the degree of divergence remained constant over a historically very eventful epoch of 60 years, with two world wars and a depression.„
James Gleick, Chaos – Making a new science

Subsequently, Mandelbrot analyzed numerous other phenomena, from electrical noise to the water levels of large rivers and the length of coastlines, and found in all of them that scale invariance, i.e., a situation whose characteristics remain largely the same regardless of the scale of the quantity under consideration. The forms were always similar to themselves. This finding practically means that electrical noise in the oscilloscope looks the same for the period of seven days as for 24 hours, 1 hour, 1 minute or 1 second.

Mandelbrot called all these shapes fractals: patterns that produce scaled-down copies of themselves when magnified. Probably the best known fractal is the little apple-man (actually Mandelbrot set).
But the forms of classical Euclidean geometry – lines, planes, circles, spheres, triangles, and cones – were not adequate to capture the complexity of these shapes. Mandelbrot was fond of saying:
„Clouds are not spheres, mountains are not cones, coastlines are not circles. The bark is not smooth – nor does lightning make its way straight.„
Benoit Mandelbrot, The fractal geometry of nature
Euclid’s 2000-year-old work, which had proven to be a powerful abstraction of reality in every practical sense, missed the true essence of the grained, crooked, broken, tangled, and interlocking things we observe around us every day. Indeed, Euclid’s work fails to accurately determine the exact length of such shapes.
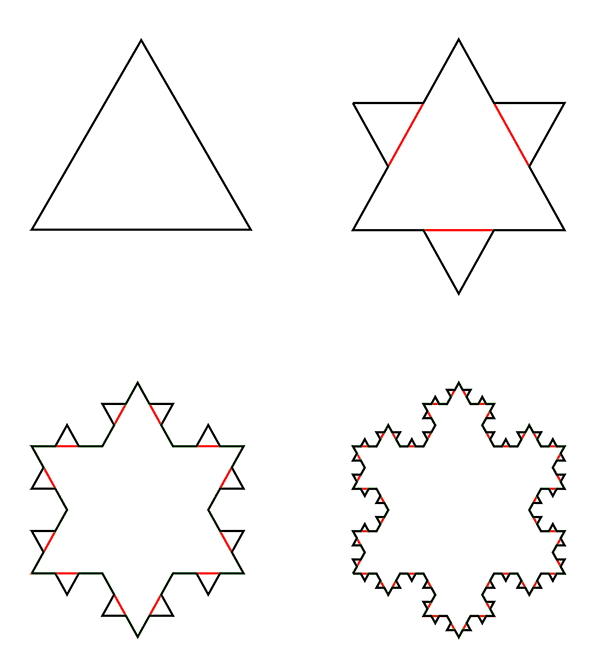
An example is the Koch Curve, first introduced in 1904 by the Swedish mathematician Helge von Koch. Like most self-similar shapes, iteration (Latin iterare: to repeat) creates the Koch curve. This mathematical term means a method of approaching the solution of a computational problem in a stepwise but purposeful manner. It consists in the repeated application of the same calculation procedure. As a rule, one iterates through feedback. The output values of a computational step, in each case, become the results of the next step. We execute this substitution process repeatedly, potentially even infinitely. To construct a Koch curve, take an equilateral triangle and add another equilateral triangle to the middle third of each side. You continue this addition as many times as you like (see figure). After only a few passes, this curve, which is so simple to construct, exhibits a degree of complexity rarely found in Euclidean geometry. However, determining the curve length is difficult. If we set the initiator with length 1, the length of the curve is 1.333 in the first step, 1.778 in the second, 2.370 in the third, 3.160 in the fourth, 4.214 in the fifth, and after an infinite number of calculation steps, the curve would be infinitely long.

Another example involves the lengths of coastlines. The map of such a course shows many small bays. However, when we gauge the length based on the map, we invariably overlook bays that are too small for printing. But even when we walk the coastline, we miss many microscopic bays between the grains of sand. – No matter how much we increase the coastline, there will always be more bays down to the atomic level.
Both the Koch Curve and the coastline reveal an intriguing paradox. This is because with each additional triangle or level of magnification, the respective line lengthens, but the area encompassed by it remains less than that of a circular stroke around the initial shape. Both lines are thus of potentially infinite length but surround a limited area.

Other phenomena to which the above attributes apply are the shapes of mountains and rivers, the branching of plants, blood vessels and alveoli, the distribution of star clusters in galaxies and the paths of thermal movement of particles in liquids and gases (Brownian motion). The human heartbeat, brain waves and breathing rhythm also follow fractal rhythms. If they become too regular, this can lead to heart failure due to congestion, shortness of breath or epileptic seizures. In normal life, all these rhythms constantly fluctuate back and forth between chaos and order. Furthermore, such structures can also be found in quantitative descriptions of human action, for example in music, painting and architecture, as well as in stock market prices. Jackson Pollock’s artworks, for example, derive their almost hypnotic power from self-similar patterns that the artist has unconsciously applied to the canvas (1).
Mandelbrot thought about how to better understand and describe the complexity he had found. Ultimately, he solved the problem by leaving behind the classical three dimensions of length, width and depth and introducing instead something almost unimaginable: fractional dimensions. Fractal geometry, named after the Latin verb frangere, which means to break, captures the degree of irregularity of an object. A short excursion into geometry makes it clear what it is all about.
A point has no length, no width and no height, thus no dimension. A line has no width and height but a length, so it is one-dimensional. A surface has length and width but no height. Therefore, it has two dimensions. Only a space, such as a large empty cube, possesses all three dimensions in addition to length and width.
Let us go one step further. We take a piece of line and double its length. This gives us two copies of the original piece. Now we take a square and multiply its length and width by two. This gives us four copies. Lastly, we work with a cube and also double its length, width and height, so we get eight copies. Then we enter all the obtained information into a table:
Figure		Dimension		Number of Copies
line 			1 			2=21
area 			2 			4=22
cube 			3 			8=23
A clear pattern emerges. If we double the sides to get a self-similar figure and write down the number of copies as a power to the number 2, the exponent gives the number of dimensions.
We can use this approach to determine the dimensionality of fractal figures. To do this, we start with the initial figure, for example, the original equilateral triangle of the Koch Curve, and perform the first iteration step. After that, we have three copies of the initial shape, so we write 3 = 2d, where d is the dimension. However, since 2 is equal to 21 and 4 to 22, which exponent is the correct one? It obviously has to be between 1 and 2. The following operation yields the correct solution:
log3 / log2 = 1.585
because
21,585 = 3
So the dimension of the Koch curve after the first iteration is 1.585. Now you cannot directly imagine such a broken dimension, but it does not lack a certain sense. For instance, the Koch curve exhibits greater roughness and crumple than a smooth, one-dimensional line or curve. Because of this roughness, it fills the space more. However, it doesn’t occupy the same space as a two-dimensional square, as it lacks any area. For this reason, it is logical that the dimension of the Koch curve and other fractal shapes is not an integer but just fractional.

Next The beautiful and the sublime
Previous Ancient teachings
If you found this post useful and want to support the continuation of my writing without intrusive advertising, please consider supporting. Your assistance goes towards helping make the content on this website even better. If you’d like to make a one-time ‘tip’ and buy me a coffee, I have a Ko-Fi page. Your support means a lot. Thank you!


 Since I started my first website in the year 2000, I’ve written and published ten books in the German language about photographing the amazing natural wonders of the American West, the details of our visual perception and its photography-related counterparts, and tried to shed some light on the immaterial concepts of quantum and chaos. Now all this material becomes freely accessible on this dedicated English website. I hope many of you find answers and inspiration there. My books are on